
Applied Fieldwork
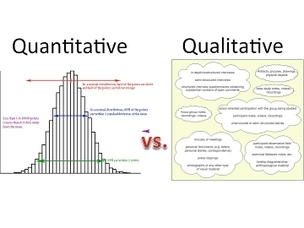
Qualative & Quantitative Data
Qualative Data is an opinion about the size, legnth, angle etc.
Quantitative data is information about quantities; that is, information that can be measured and written down with numbers. Some examples of quantitative data are width, height, and legth of a pebble, angle of beach and volume of a pebble.
Primary and Secondary Data Collection
Primary data is data collected from a first-hand experience. i.e pebble size or angle of slope.
Secondary data is data that has been published or data collected in the past or by other parties / people, i.e data found in a map or in a textbook.
Primary data is data collected from a first-hand experience. i.e pebble size or angle of slope.
Secondary data is data that has been published or data collected in the past or by other parties / people, i.e data found in a map or in a textbook.
Random, Stratified and Systematic Data
Random data is where you take readings with no systematic pattern , take it randomly, i.e in a flat sandy beach you could assume that the climate does not change and therefore you can take tests from anywhere on the beach.
Systematic sampling is used when the study area includes an environmental gradient. With an environmental gradient you would expect a variable to change in a regular manner as you move away from the start of your survey e.g. the gradient of the beach every 30 metres.
Stratified sampling is used when the study area includes significantly different parts (also known as subsets). You should make sure that the number of samples taken is representative of the importance of each subset within the total population. In a rivers investigation into the effect of stream ordering on discharge, a stratified sample would be to choose sites where the two river segments of the same order join.
What Is A Transect
A transect is a line following a route along which a survey or observations are made. The transect is an important geographic tool for studying changes in human and/or physical characteristics from one place to another.
A transect is a line following a route along which a survey or observations are made. The transect is an important geographic tool for studying changes in human and/or physical characteristics from one place to another.
How We Collected Our Data
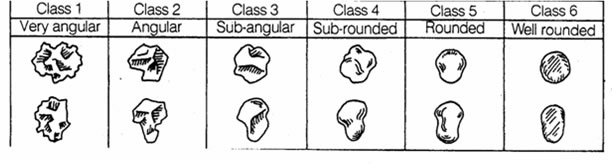
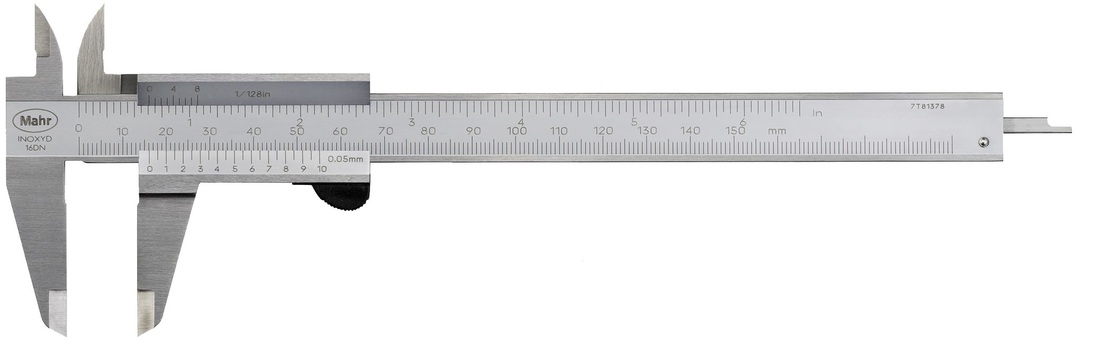
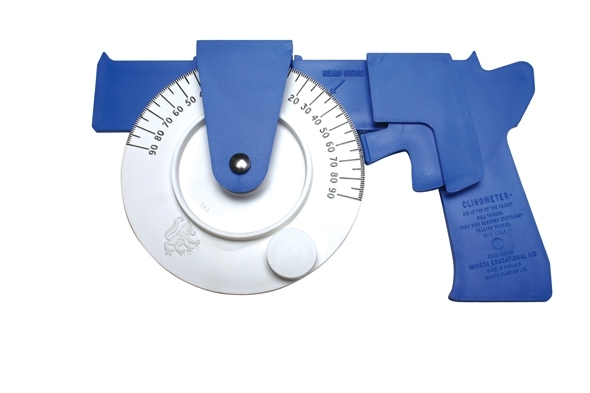
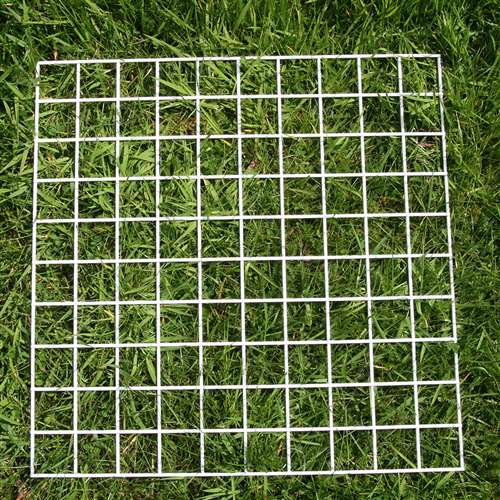
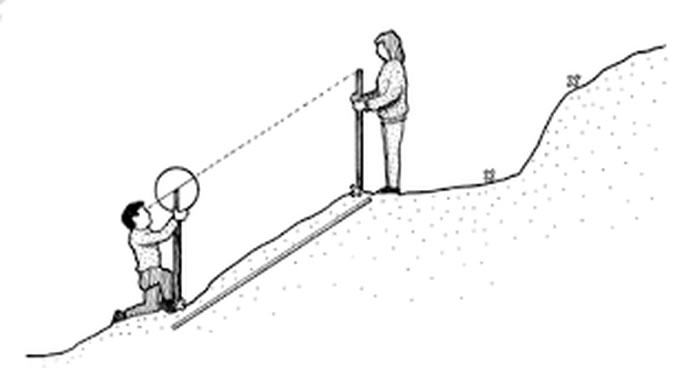
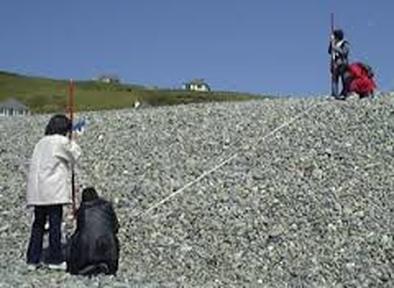
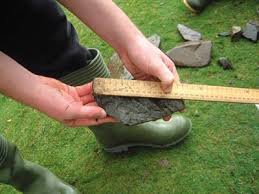
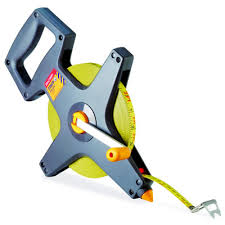
We put a tape measuring , and measured from the coast, at a perpendicular line to the sea, to the edge of the path. Then using the systematic data we measured every 3 meters, we put a tape measure (seen below) and measured out the 3 meters. At every 3 metets we would stick two meter sticks in the ground, we then measured the gradient with a gun clinometer (seen below), by putting the gun on the meter stick closest to the coast and then pointing it at the other meter stick and pressing the trigger.We also measured the length, height and width of pebbles every 3 meters, we picked the pebbles by placing down a quadrat (seen below) and picking pebbles from all 4 corners and the centre.. We measured this using calipers (seen below). We judged whether the pebbles were rounded or angular by using the powers table (seen below).We then we measured the volume of pebbles by putting them in water and measuring the difference when the pebbles were in the water and when the pebbles weren't in the water.
My measurement and results were quite accurate as we measured in centimeters and the millimeters, making our results more reliable as pebbles are not to an exact centimeter, so to measure in millimeters adds more accuracy as you can specify the exact size.

Null Hypothesis
Our hypothesis was that l0ngshore drift does not go from west to east.
Our hypothesis was that l0ngshore drift does not go from west to east.
Longshore Drift
From the data we can see that longshore drift goes from west to east. Therefore our hypothesis is wrong. We can tell that the longshore drift is going from west to east because on the west side of the groyne the shingle and sand have collected up to form a 7 and a half metre mound. Whereas on the east the sand is only piled up to 3m.
From the data we can see that longshore drift goes from west to east. Therefore our hypothesis is wrong. We can tell that the longshore drift is going from west to east because on the west side of the groyne the shingle and sand have collected up to form a 7 and a half metre mound. Whereas on the east the sand is only piled up to 3m.
What We Did
We collected 5 different transects between 2 groynes, we also measured the volume, height, width and depth of 5 different pebbles every 5 meters across the transects.
We collected 5 different transects between 2 groynes, we also measured the volume, height, width and depth of 5 different pebbles every 5 meters across the transects.
If you want to find out more about Geography fieldwork go here: http://www.geography-fieldwork.org/
